Cincopa Video Analytics gives you powerful visibility into how your videos are performing online. Track where your views are coming from, how viewers interact with your content, and access in-depth stats for every video. You can even organize this data by webpage, domain, or country.
This guide will help you unlock the full potential of Cincopa’s advanced analytics to elevate your video strategy.

Analytics Dashboard Overview
The dashboard offers a snapshot of your embedded videos’ performance across a selected timeframe. To analyze a specific period, simply adjust the calendar filter above the graph.
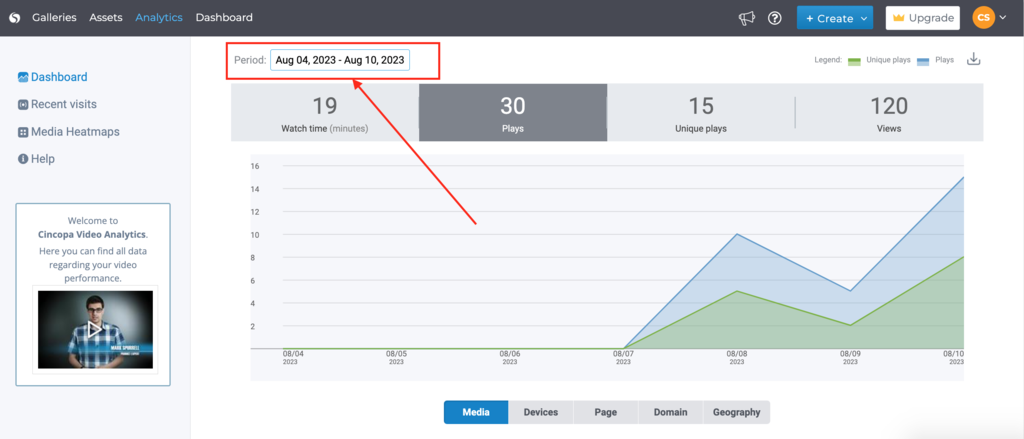
Views
The Impressions graph shows how many times a webpage with an embedded video was loaded while the video was available to view. A View is recorded each time a user clicks the Play button.
Plays
This metric counts the total number of times content has been played—regardless of who played it. Example: One person watching a video three times equals three plays.
Unique plays
Unique Plays represent the number of distinct users who played a video within the selected timeframe—regardless of how many times each user watched it. Example: If five people each watch a video once, that’s five unique plays. If one person watches it ten times, it still counts as one unique play.
Watch time
The Watch Time graph shows the total viewing time (in hours) users spent watching a specific video or group of videos. You can view this data by video, webpage, site, or country—and also see the total watch time for your entire account. Example: If three users each watch a 10-minute video for 5 minutes, the total watch time is 15 minutes.

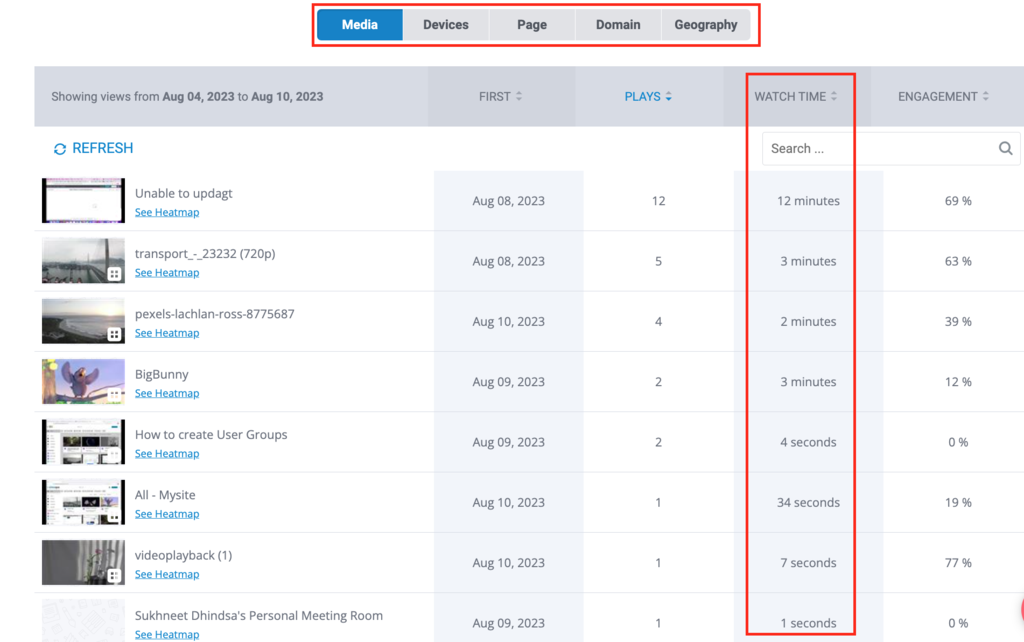
In-Depth Stats & Sorting
Under the graph, you’ll find a detailed stats table. You can switch between tabs to view analytics by:
-
Media: Stats for all video assets in your account.
-
Page: Webpages that include embedded videos.
-
Domain: Domains where the videos are hosted.
-
Geography: Countries where views originated.
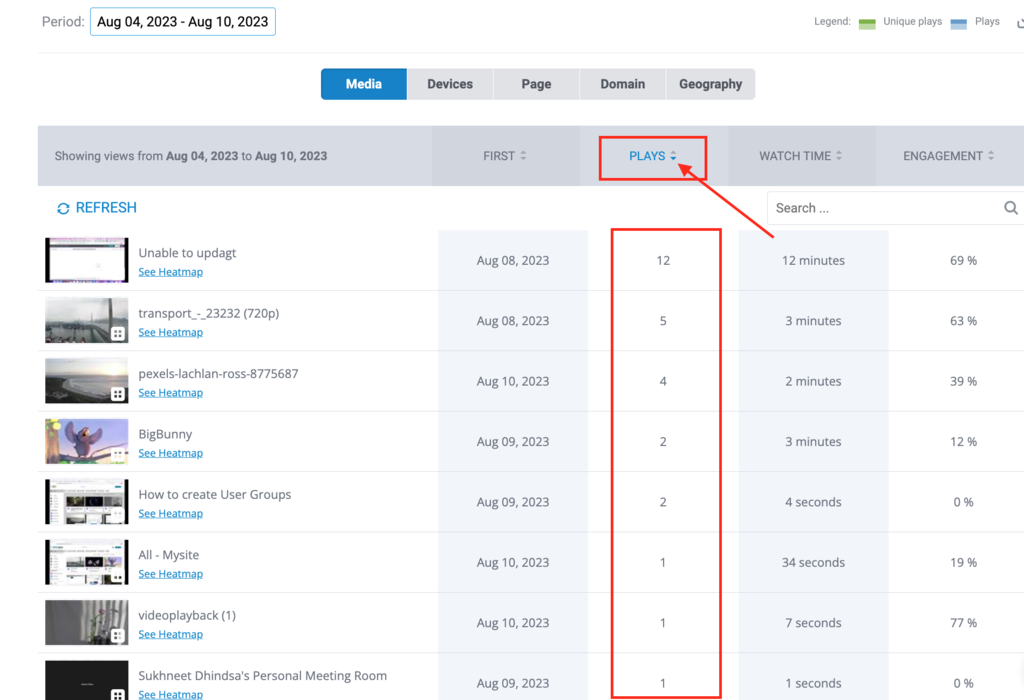
You can sort the table by:
-
Time of activity
-
Number of plays
-
Watch time
-
Engagement rate
Click any table header to toggle ascending or descending order.
Click on the corresponding section in the table header to select the sorting method (available both in ascending and descending order).
Drill-Down Insights
Click any row in the stats table to explore detailed analytics for that specific video or context.
Video Heatmaps
Heatmaps provide a visual breakdown of viewer engagement as the video progresses. They help you understand where viewers drop off, rewind, or stay most engaged. To access heatmaps:
- Go to the Media tab
- Click on any video thumbnail
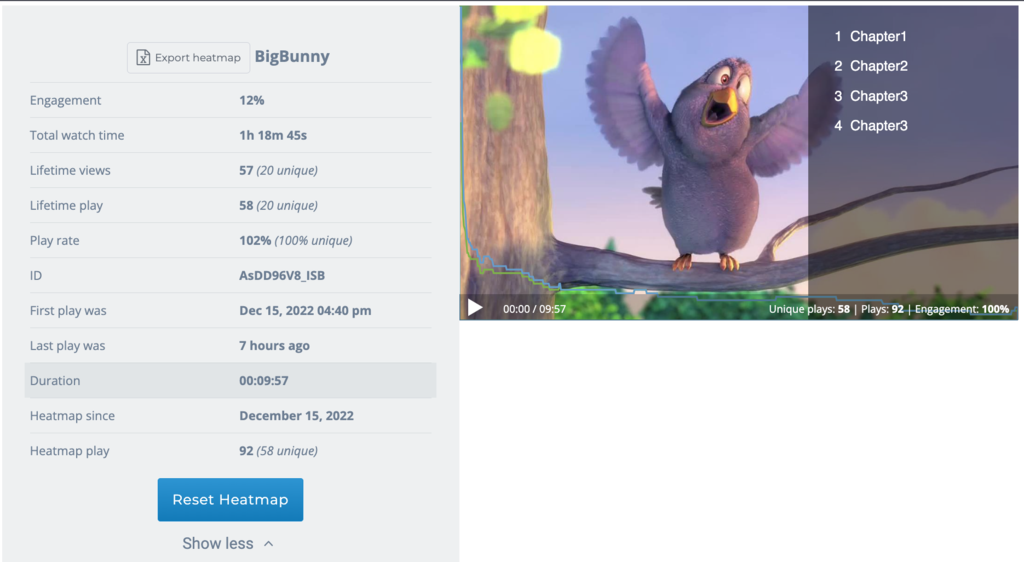
Hover over the heatmap graph to explore user interaction by second. Click to play/pause the video or double-click to jump to a specific timestamp.
On the side, you’ll see:
-
Engagement Rate: % of viewers still watching as the video plays
-
Total Watch Time: Aggregate time users spent watching
-
Play Rate: Ratio of views to impressions
A list of individual viewers appears below the graph. Click on any user’s avatar for more insights.
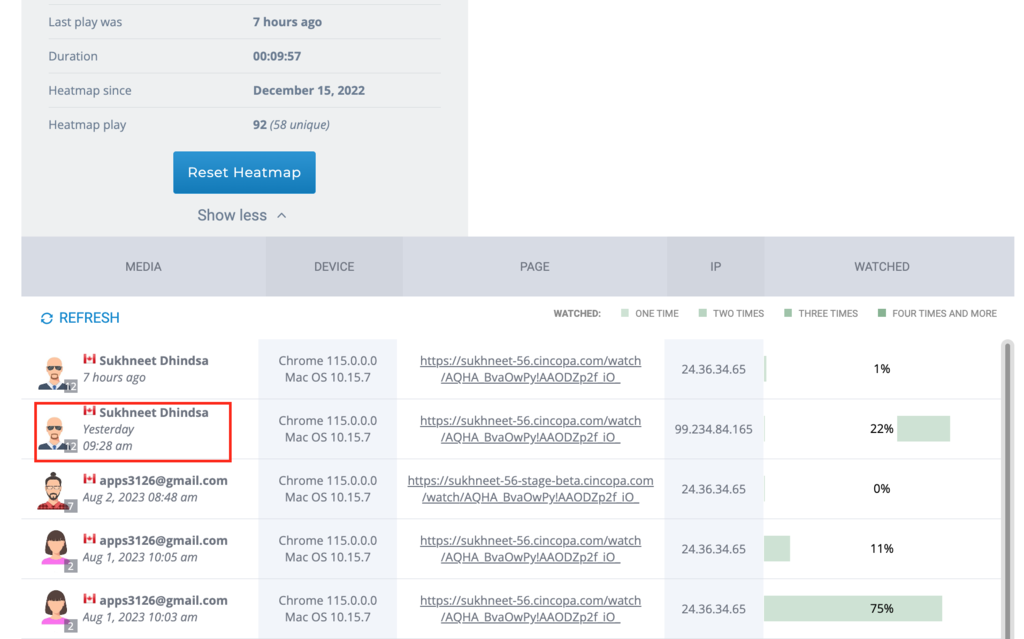
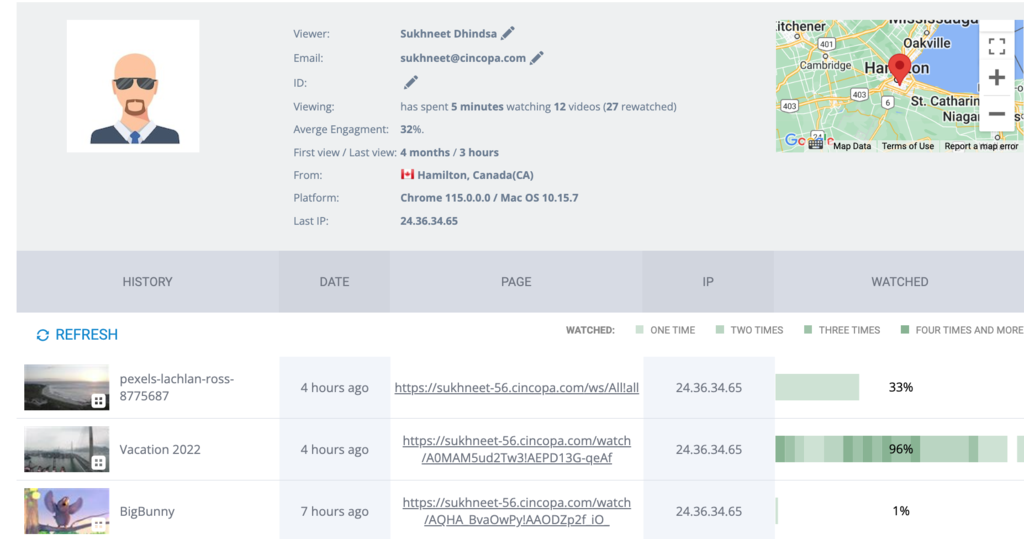
User screen
The User screen gives a full profile of each viewer’s activity, including:
-
Location
-
Viewing time
-
Average engagement
-
First and last view dates
-
Platform used
-
IP address
This helps you personalize follow-ups and better understand your audience.